Graphical User Interface (GUI)
Central element of the toolbox is a graphical user interface (GUI). This GUI does in no way replace the functions that are called from the command line (CLI), but makes it easy to access and use them via a graphical interface.
Overview
The GUI consists of a main window allowing the user to open additional windows to perform more complex tasks on a given dataset.
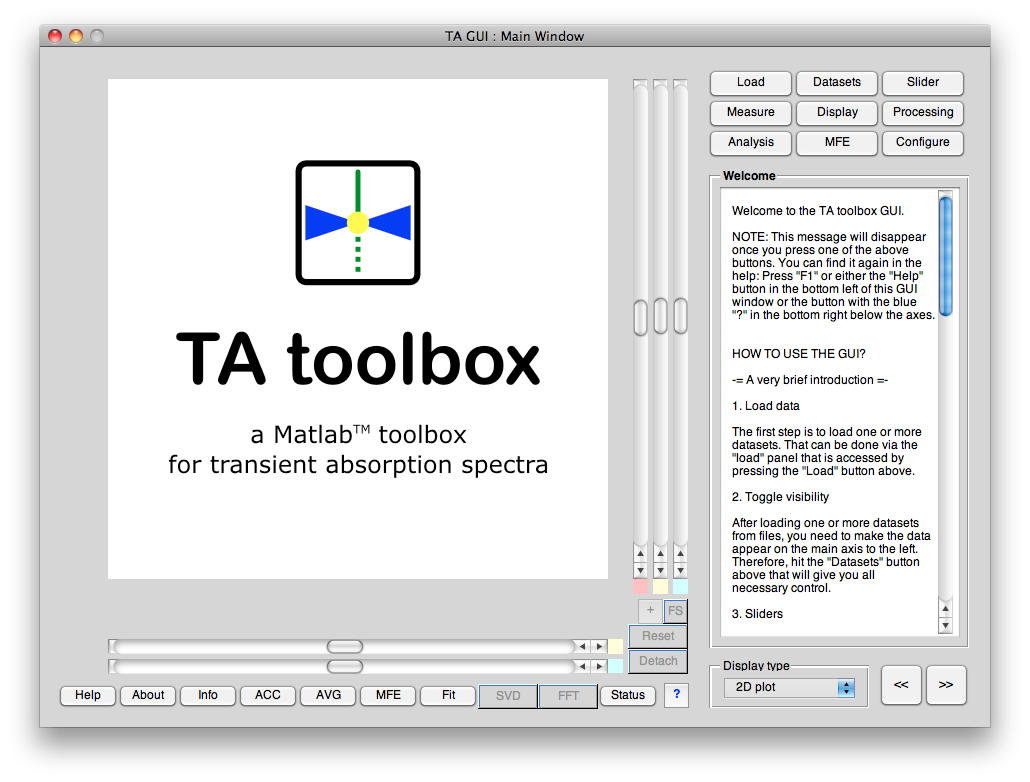
The figure below provides a first glance of the GUI. Please note that details are very likely to change during the further development.
The different GUI windows
The GUI consists of one main window that allows you to open additional GUI windows for different tasks, if necessary, such as accumulation of several datasets. To give you a short introduction to the GUI and its functions, in the following all the different GUI windows will be documented with text and images.
- The main window of the TA GUI
This window gets opened via the Matlab command line, and from here, you access all functions and other GUI windows as necessary.
- The Info GUI window: Information about the current dataset
Provides access to all paramters of a given dataset, its history, and all other informations that may be known. Furthermore, it gives you full control over all those informations and lets you change all parameters and complete informations.
- The ACC GUI window: Accumulate datasets
Accumulate datasets can be rather complex, therefore a separate window for that task.
- The AVG GUI window: Averaging datasets in one dimension
This GUI allows to average datssets along one of their two dimensions. The result will be a 1D dataset.
- The MFE GUI window: Display and analyse magnetic field effects
If you have recorded datasets both with and without applied magnetic field (to investigate magnetic field effects, MFE), you probably want to analyse the MFE in more detail, such as calculating time-averaged MFEs and having a look at the statistics.
- The Fit GUI window: Fitting arbitrary functions to your data in 1D
Perhaps the most often request is to fit a decay with an exponential. Given that the underlyingTAfitfunction is highly configurable, you're not restricted to only this case.
More windows will follow over time, as soon as the GUI windows are functional and in a somewhat stable state with respect to their layout.
Please note: Every GUI window has normally its own, built-in help that can be accessed via this button:

Normally, this built-in help function is the most up-to-date source of help for how to use the respective GUI. And as the rest of the GUI, these help texts are written in English (or, some sort of English).