Table of Contents
The ACC GUI Window
Accumulate datasets.
Introduction
A rather short introduction to the ACC GUI.
If in a hurry
![]() Given that you want to accumulate similar datasets and did not do any special things to them, the default settings should be fine. Select your datasets to accumulate, switch to the “Accumulate” panel, have a look at the proposed label for the accumulated data, hit <key>Accumulate</key> or <key>Apply</key> (as you like) and if everything is fine, <key>Close</key> the GUI and your accumulated data will be in the main GUI. If unhappy, <key>Discard</key> and try other settings, or <key>Discard</key> and <key>Close</key>.
Given that you want to accumulate similar datasets and did not do any special things to them, the default settings should be fine. Select your datasets to accumulate, switch to the “Accumulate” panel, have a look at the proposed label for the accumulated data, hit <key>Accumulate</key> or <key>Apply</key> (as you like) and if everything is fine, <key>Close</key> the GUI and your accumulated data will be in the main GUI. If unhappy, <key>Discard</key> and try other settings, or <key>Discard</key> and <key>Close</key>.
Please note: The accumulated data gets written to the main GUI only when closing the ACC GUI (and only if you hit <key>Apply</key> before).
To the gentle reader
The accumulation (ACC) GUI is dedicated to the task of accumulating multiple datasets. Basically, it does not care about what data you want to accumulate, as long as they share at least a minimum amount of similar parameters and are of a format that the GUI recognises. It provides the user with the necessary controls to perform the accumulation itself.
Please note: Whether it makes sense to perform the accumulation with the given set of data remains totally with the user.
Accessing the ACC GUI
There are two ways how to access the ACC GUI: Either press the <key>ACC</key> button located in the row of buttons at the bottom left of the Main GUI window, or press <key>F4</key>. This will open the ACC GUI window, as shown below.
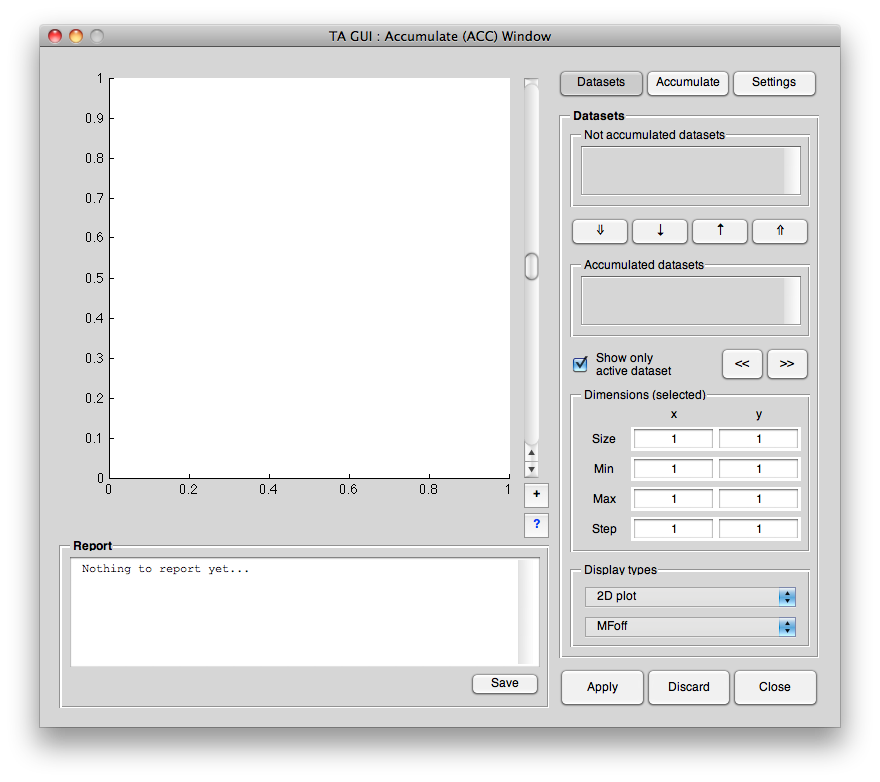
GUI layout
Basically, the ACC GUI window is divided into three parts: The main axis to the left, the panels to the right (again, there are three different panels there), and the report panel on the bottom left. You can switch between the panels on the right with the buttons on the top or via shortcuts <key>Ctrl-1</key> to <key>Ctrl-3</key>.
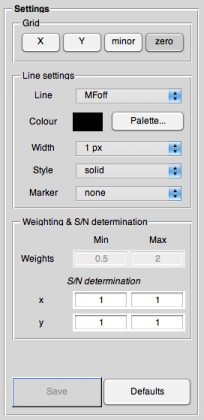
More details to all the different panels and the meaning of their control elements can be found in the respective help topic:
What follows is a sketch of the typical operation of this GUI.
Normal operation
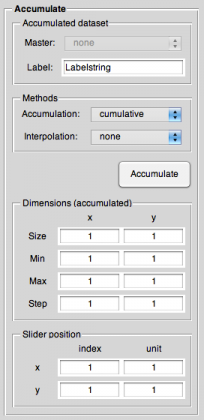
Normally, you simply go through the panels, first deciding about which datasets to accumulate, then checking the accumulation settings, the interpolation method, and then, after you have setup all things, you hit <key>Accumulate</key> or <key>Apply</key> to apply those parameters to the selected datasets and perform the actual accumulation.
After you did that, you will see the result in the main axis, where you can inspect it in the ususal way, as 2D or 1D plots, and for the latter at any position of the other axis, respectively. Of course, the latter only applies to the case where you have 2D data. The controls for switching the display modes are located at the bottom of the datasets panel, whereas the current position of the slider get's displayed on the bottom of the accumulate panel.
Additionally, you will find a summary of the performed action in the report panel below the axes.
If happy with the results, simply <key>Close</key> the GUI and your data will be written to the main GUI. If unhappy, hit <key>Discard</key> and either start a new round with different parameters or <key>Close</key> the GUI without writing back anything to the main GUI.
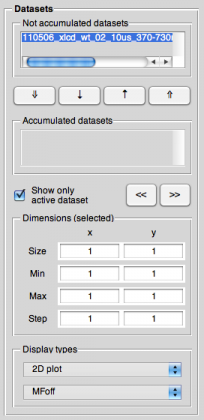
What gets displayed in the main axis?
As long as you have not done an actual accumulation, the main axis will show the datasets you selected to accumulate. If the checkbox “Show only selected dataset” is ticked, only the currently selected spectrum will be displayed, otherwise all spectra that have been selected to be accumulated. Once you hit <key>Accumulate</key> or <key>Apply</key> and successfully performed an accumulation, the accumulated dataset will be displayed in the main axis.