Table of Contents
ACC GUI: Accumulate Panel
The accumulate panel lets you perform the actual accumulation and review the results.
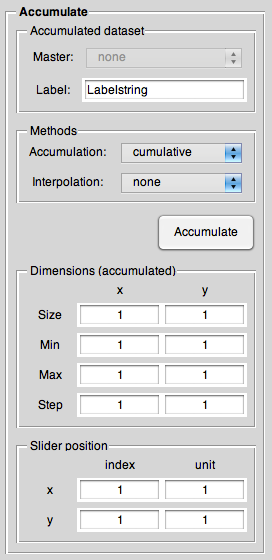
Accumulated dataset
This panel lets you control both which dataset to use as a “master” and what label the new dataset (containing the accumulated data) should have.
Master
Only important if you have datasets with different spacing of the axes and/or if you use interpolation (i.e., in case of nonidentical axis values, but overlapping axes regions), this popup menu lets you choose which dataset to use as a master defining the “template” the axes of all other datasets get interpolated to (if necessary).
Label
Every dataset loaded has a label (although not necessarily a unique one, as they get recognised internally not by their label, so you are free to use whatever label suits best your needs). As accumulation creates a new dataset, you can (and should) specify a label for it here.
Please note: The initial suggestion for the label gets determined by the label of the dataset selected as master, but only once at the beginning. As soon as you change something, the GUI assumes that you may have changed the label as well and does not touch it any more. Therefore, when selecting a different master, please make sure that you update your label if necessary.
Methods
This is the place where to choose both the accumulation and the interpolation method used for accumulating your selected datasets.
Accumulation method
The accumulation settings panel lets you choose between (currently two) different types of accumulation: cumulative sum and weighted sum.
Normally you want to choose the first option, cumulative. This performs a simple sum operation on the selected datasets (of course handling all other things as choosing the overlapping part of the axes and interpolate if necessary), and afterwards divides by the number of accumulated datasets. Therefore, it is identical to the arithmetic sum.
If you choose “Weighted” it performs a sum weighted by the best achievable signal to noise ratio. Additionally, you can specify the minimum and maximum weighting factor in the settings panel.
Note: Currently, only the “cumulative” method is supported, the other will produce an error message in the report window.
Interpolation method
Given the fact that you want to accumulate datasets that do not share identical values for their axes, you need to perform an interpolation on at least one of them to be able to sum them up.
Here, the “master dataset” settings from the datasets panel becomes important, as it sets the reference all other datasets get interpolated to.
In the simplest case, you have just different step sizes of the axes with partly identical values (e.g., one spectrum with 1 G field resolution, another one with 0.5 G field resolution).
If you want to go for the larger stepping, you can set the interpolation method to none and simply select the dataset with the larger stepping as the master.
Otherwise, you need to choose between one of several interpolation methods:
- linear
- Linear interpolation
- spline
- Cubic spline interpolation
- cubic
- Piecewise cubic Hermite interpolation
For further details, refer to the MATLAB® documentation for the “interp1” function.
Please note: If you specify here whatever interpolation method, but the accumulation function detects that no interpolation is necessary, it will not perform any interpolation and state that fact in the accumulation report.
Vice versa, if the accumulation function detects that interpolation is necessary to accumulate datasets, but you didn't specify an interpolation method here, it will use “linear” as a default and tell you about it in the accumulation report.
Accumulate button
Basically, whether you hit the Accumulate button here or the Apply button on the bottom, does not matter. Both perform the accumulation with the parameters currently set.
Dimensions (accumulated)
In terms of its controls identical to the subpanel of the datasets panel, the dimensions subpanel gives you an easy overview over the dimensions of the accumulated (i.e. newly created) dataset.
Slider position
Given that you loaded a 2D dataset and are currently displaying a 1D representation along one of the two axes, you can set and get the axis positions along x and y here, both as index and unit (if available).