Table of Contents
The AVG GUI Window
Averaging datasets in one dimension.
Introduction
A rather short introduction to the AVG GUI.
If in a hurry
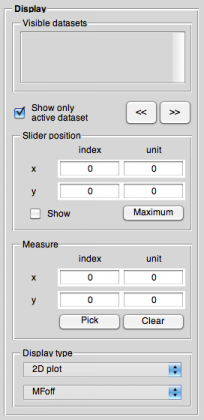
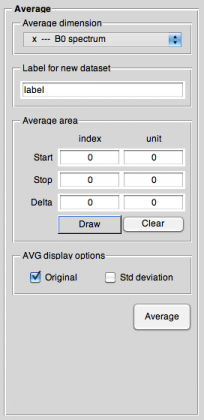
![]() Select the dataset you want to average in the “Visible datasets” listbox in the “Display” panel, press the “Maximum” button in the “Slider position” panel (that will show the dataset at the maximum in the lower, auxilliary panel), change to the “Average” panel, select which dimension you want to average along, have a look at the label string, select the area to average over, press “Average”, and if happy with the result, press “Apply”. (Repeat those steps for all other datasets you want to average.) Press “Close”.
Select the dataset you want to average in the “Visible datasets” listbox in the “Display” panel, press the “Maximum” button in the “Slider position” panel (that will show the dataset at the maximum in the lower, auxilliary panel), change to the “Average” panel, select which dimension you want to average along, have a look at the label string, select the area to average over, press “Average”, and if happy with the result, press “Apply”. (Repeat those steps for all other datasets you want to average.) Press “Close”.
To the gentle reader
The Average (AVG) GUI is dedicated to the task of averaging datasets in either of their two dimensions. These averaged datasets get stored as (new) 1D datasets in the main GUI.
Accessing the AVG GUI
There are two ways how to access the AVG GUI: Either press the <key>AVG</key> button located in the row of buttons at the bottom left of the Main GUI window, or press <key>F5</key>. This will open the AVG GUI window, as shown below.
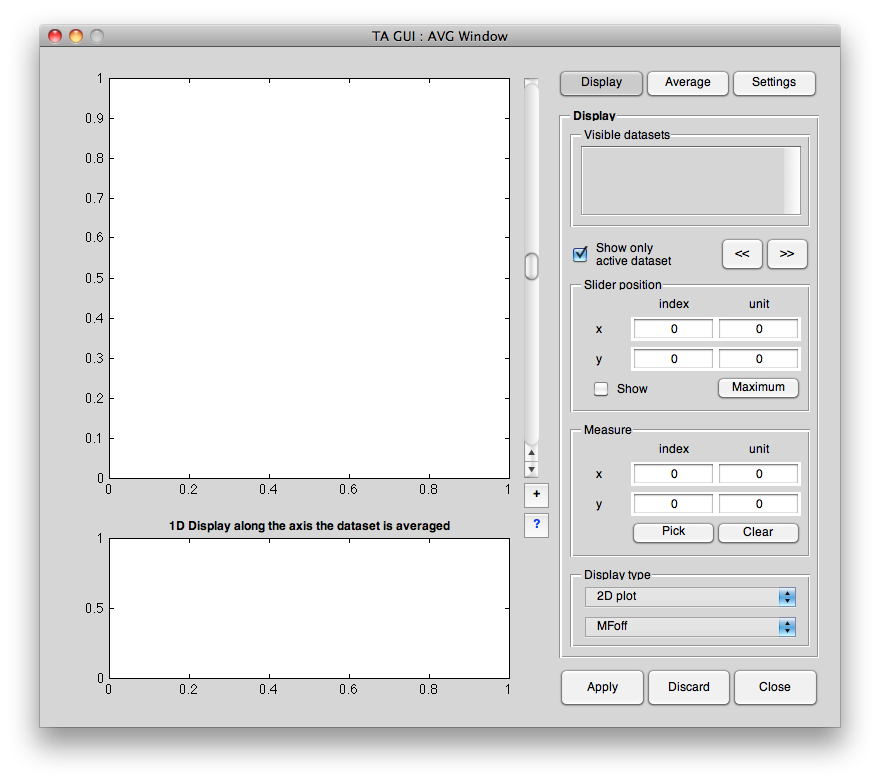
GUI layout
Basically, the AVG GUI window is divided into three panels that are all located to the right. You can switch between them with the buttons on the top or via shortcuts Ctrl-1 to Ctrl-3.
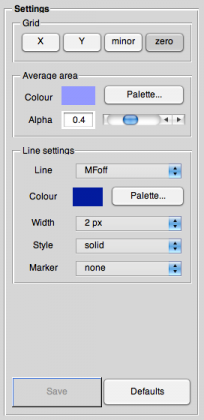
More details to all the different panels and the meaning of their control elements can be found in the respective help topic:
What follows is a sketch of the typical operation of this GUI.
Normal operation
Normally, you simply go through the panels, first deciding about which dataset to average, set the axes to a reasonable point that allows you to observe in the lower, auxilliary axes the area you are averaging over (the easiest way to achieve that might be to press the <key>Maximum</key> button in the “Slider position” subpanel in the display panel), then switch to the average panel, set the area to average over, and finally hit the <key>Average</key> button.
After you did that, you will see the result in the main axis, where you can inspect it in the ususal way, and compare it to the full (original) dataset.
If happy with the results, press the <key>Apply</key> button, perform the same tasks with any other dataset, and in the end, simply <key>Close</key> the GUI and your data will be written to the main GUI as new datasets. If unhappy, hit <key>Discard</key> and either start a new round with different parameters or <key>Close</key> the GUI without writing back anything to the main GUI.