Table of Contents
Fit GUI: Fit Panel
The fit panel lets you set all the crucial parameters for the actual fit.
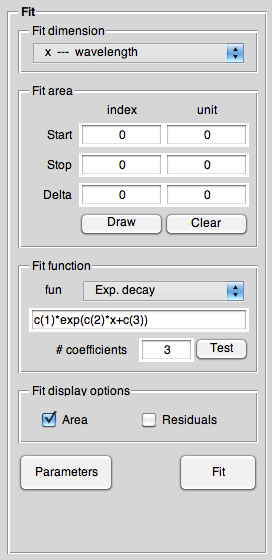
Fit dimension
First of all, you need to decide in what dimension you want to perform the fit. Note that this is independent of the current display mode.
Fit area
To tell the fit function which area actually to fit, this area needs to be defined. The most convenient way to do so would be to use the pointer and draw those areas. As this is not yet supported, you have to type the numbers in the respective edit fields manually.
If you want to hide the area, but not get rid of it, e.g. after you fitted successfully and want to inspect in more detail the fit, without loosing the settings for the fit area, untick the box “Area” below in the “Fit display options” subpanel, and the areas will still be present, but not displayed.
To remove the fit area, use the <key>Clear</key> button.
The appearance (colour and transparency) of the fit area can be changed in the settings panel. See there for details.
Fit function
The core of all fitting tasks is to select the actual function to fit to your data. Here, you can choose between a set of predefined functions, such as “linear”, “quadratic”, “Exp. decay”, and “Biexp. decay”. Each of these functions is displayed in the edit field below the popup menu.
Hint: You can define your own fit functions that get displayed here if you edit the respective configuration file of the TAfit function.
The button <key>Test</key> is not yet functional, it will be the way to test user-defined fit functions that got directly defined in the above edit field.
Fit display options
The checkbox “Area” lets you control whether the fit area gets displayed or not. It might be useful to hide the area if you want to inspect your fit in more detail.
The “Residuals” checkbox lets you display the residuals.
Parameters
To set all the additional fit parameters, press the <key>Parameters</key> button. That will open an additional window, normally to the right of the current GUI, where you can set the fit routine used (the actual Matlab function), its options, and the coefficients for the fit function.
The parameters window gets described in more detail on its own page.
Fit
This button performs finally the actual fit. Results will (hopefully) appear in the main axis, and a report of the fitting process will be displayed in the report panel below the main axis.