Table of Contents
Fit GUI: Settings Panel
The settings panel allows you to control the appearance of many of the elements in the main axis.
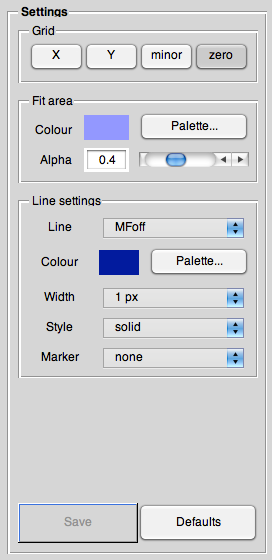
Grid
Whether or not to display a grid in one or both directions, display a minor grid, and whether to show a line at zero.
Fit area
This lets you change the appearance (colour and transparency) of the fit areas.
The colour is displayed and can be set nearly arbitrarily by pressing <key>Palette</key>. The “Alpha” value is the measure of transparency. It can be changed both with the slider or by directly entering a value in the edit field. Beware that valid values are between 0 (clear) and 1 (opaque).
Line settings
To change the way the different traces are displayed in the main axes, you can change here both colour and line settings, the latter being style, marker, and width.
Save
Later on, there will be the possibility to save the (changed) settings to a configuration file.
Defaults
To reset all settings to their default values, press this button. Note: There is no way to “undo” this.