Table of Contents
Fit GUI: Display Panel
The display panel lets you choose which of the datasets currently loaded in the main GUI should be used for fitting, set the display type and the slider parameters. In addition, it allows you to measure points and set additional reference lines.
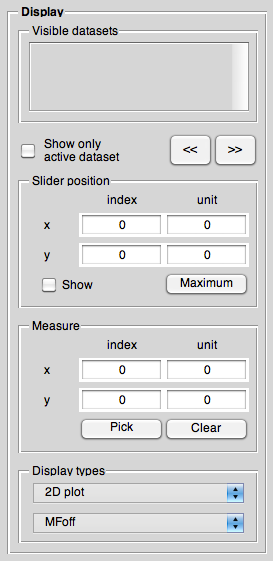
Datasets
When opening the Fit GUI, all datasets that were set to “visible” in the main GUI show up in the list of datasets. Here, you can choose the dataset you want to fit.
The checkbox “Show only active dataset” currently does nothing, the two buttons to the right, <key>«</key> and <key>»</key>, can be used to scroll through the datasets.
Slider position
Given that you loaded a 2D dataset and are currently displaying a 1D representation along one of the two axes, you can set and get the axis positions along x and y here, both as index and unit (if available).
The checkbox “Show” toggles between the display of red lines for the position in x and y in the display.
With <key>Maximum</key> you can conveniently set the position both in x and y to the maximum of the dataset.
Hint: You can use the keyword “end” in all these edit fields to specify the end of the respective axis. This is true both for the “index” and for the “unit” edit fields.
Measure
To measure points, press <key>Pick</key> and select a point with the mouse in the main axis. The display will show you the position both in x and y while you are moving the pointer within the axis. Once you click, the measurement is finished and the final coordinates are displayed.
To clear the coordinates, press <key>Clear</key>.
Display types
The display types popupmenus are the well-known control elements from the main GUI that allow you to switch both between 2D and 1D representations and between the different MFE display modes.
Hint: You can conveniently switch between the different 2D and 1D display modes via the keyboard shortcuts <key>Ctrl+x</key>, <key>Ctrl+y</key>, and <key>Ctrl+z</key>.